
Customizing Live Data Layout
In Debug Tools, the live data area can be customized to include row lines, additional data columns, log count summaries, and group similar data together.
Layout Options
The below layout options are available in the View tab.
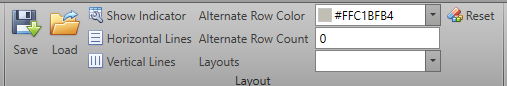
| Save | Save the currently configured layout. |
| Load | Load a previously configured layout. |
| Show Indicator | Displays an indicator for the currently selected row. |
| Horizontal Lines | Displays lines between the rows. |
| Vertical Lines | Displays lines between the columns. |
| Alternate Row Color | A color to use on alternating rows. |
| Alternate Row Count | The number of rows before alternate rules apply (e.g., Alternate Row Color). |
| Layouts | Select a previously saved layout option. |
Data Grid
The below data grid options are available in the View tab.
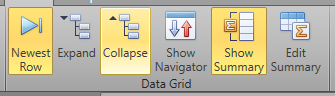
| Newest Row | Display the newest row at the top of the data area. |
| Expand | Expand displayed information in each row. |
| Collapse | Collapse displayed information in each row. |
| Show Navigator | Display the navigation panel. |
| Show Summary | Display the summary panel. |
| Edit Summary | Edit the information displayed by the summary panel. |
Columns
The below column options are available in the View tab.
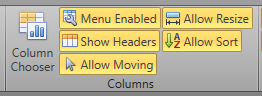
| Column Chooser | Change which columns are displayed. Click and drag items
to or from the Column Chooser panel to add
or remove them from view.
Note: Allow Moving must be enabled to do this.
|
| Menu Enabled | Enable the menu. |
| Show Headers | Display headers for the columns in the live data area. |
| Allow Moving | Allow the columns to be moved from their current position. |
| Allow Resize | Allow the columns to be resized. |
| Allow Sort | Allow the rows to be sorted. |
Grouping
The below grouping options are available in the View tab.
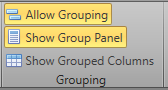
| Allow Grouping | Allow columns to be grouped together. |
| Show Group Panel | Display the group panel. |
| Show Grouped Columns | Display the columns which are grouped together. |