Sparkline
The Sparkline item allows you to place simple charts into your report.
To add a Sparkline to your report, follow the below steps.
-
Set the data for this chart by dragging and dropping a field or parameter
from the Field List onto the Sparkline.
-
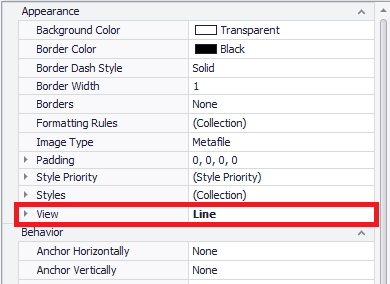
To set the type of chart displayed, go to the Property Grid
and select the chart type from the View drop-down.
The types available are:
- Line
- Area
- Bar
- WinLoss