
Access and Identity Management Dashboard
The Access and Identity Management Dashboard is where you can create Group and User profiles that will be used in your project once Security is enabled.
Users Dashboard
This dashboard allows you to manage users within your project.
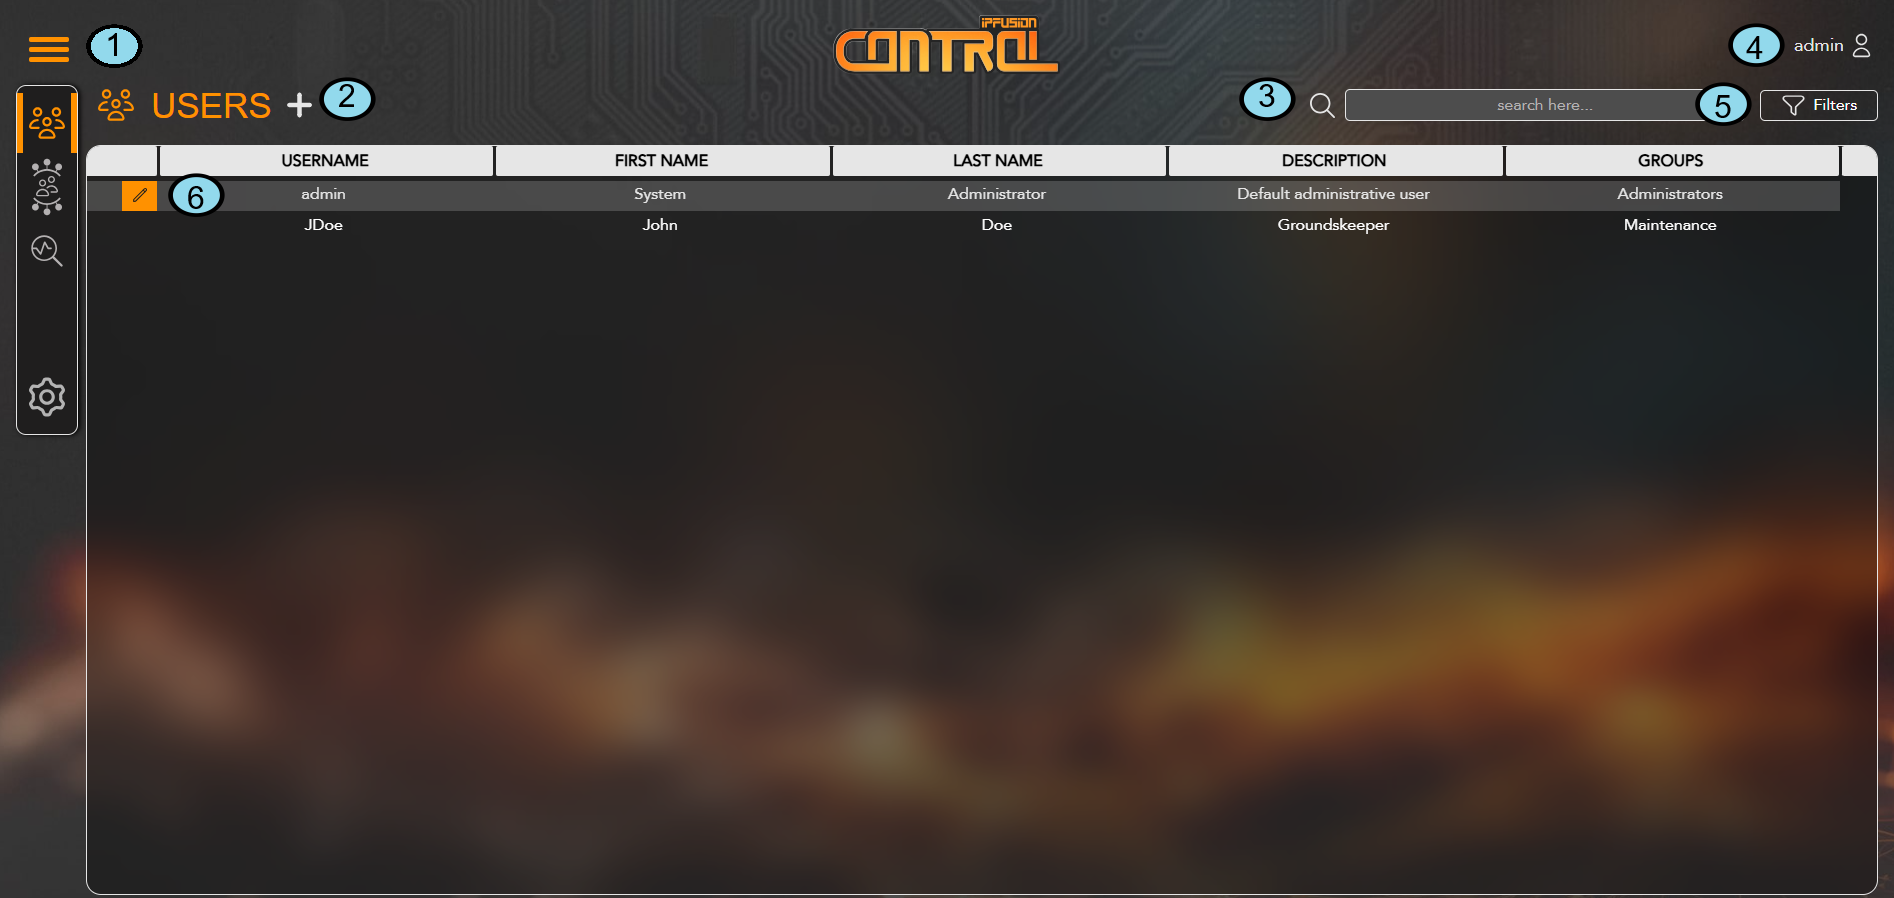
| 1. Menu | Displays the three tabs used for navigating between the Users, Groups, Diagnostics, and Admin interfaces. |
| 2. Users + | Click the + sign to add a new user. |
| 3. Search Bar | Use the search bar to locate specific words or details within user profiles. |
| 4. User Profile | Quickly access options to change the user’s password or PIN, or to logout. |
| 5. Filters | Click the Filter button to sort users by their Active status. |
| 6. Edit User Profile | Click the Edit icon to update a user profile or toggle its Active status. |
Groups Dashboard
This dashboard lets you handle the groups in your project. After creating a group profile, you can now assign users to the group. This dashboard allows you to edit or delete group profiles and enable or disable their manager status.
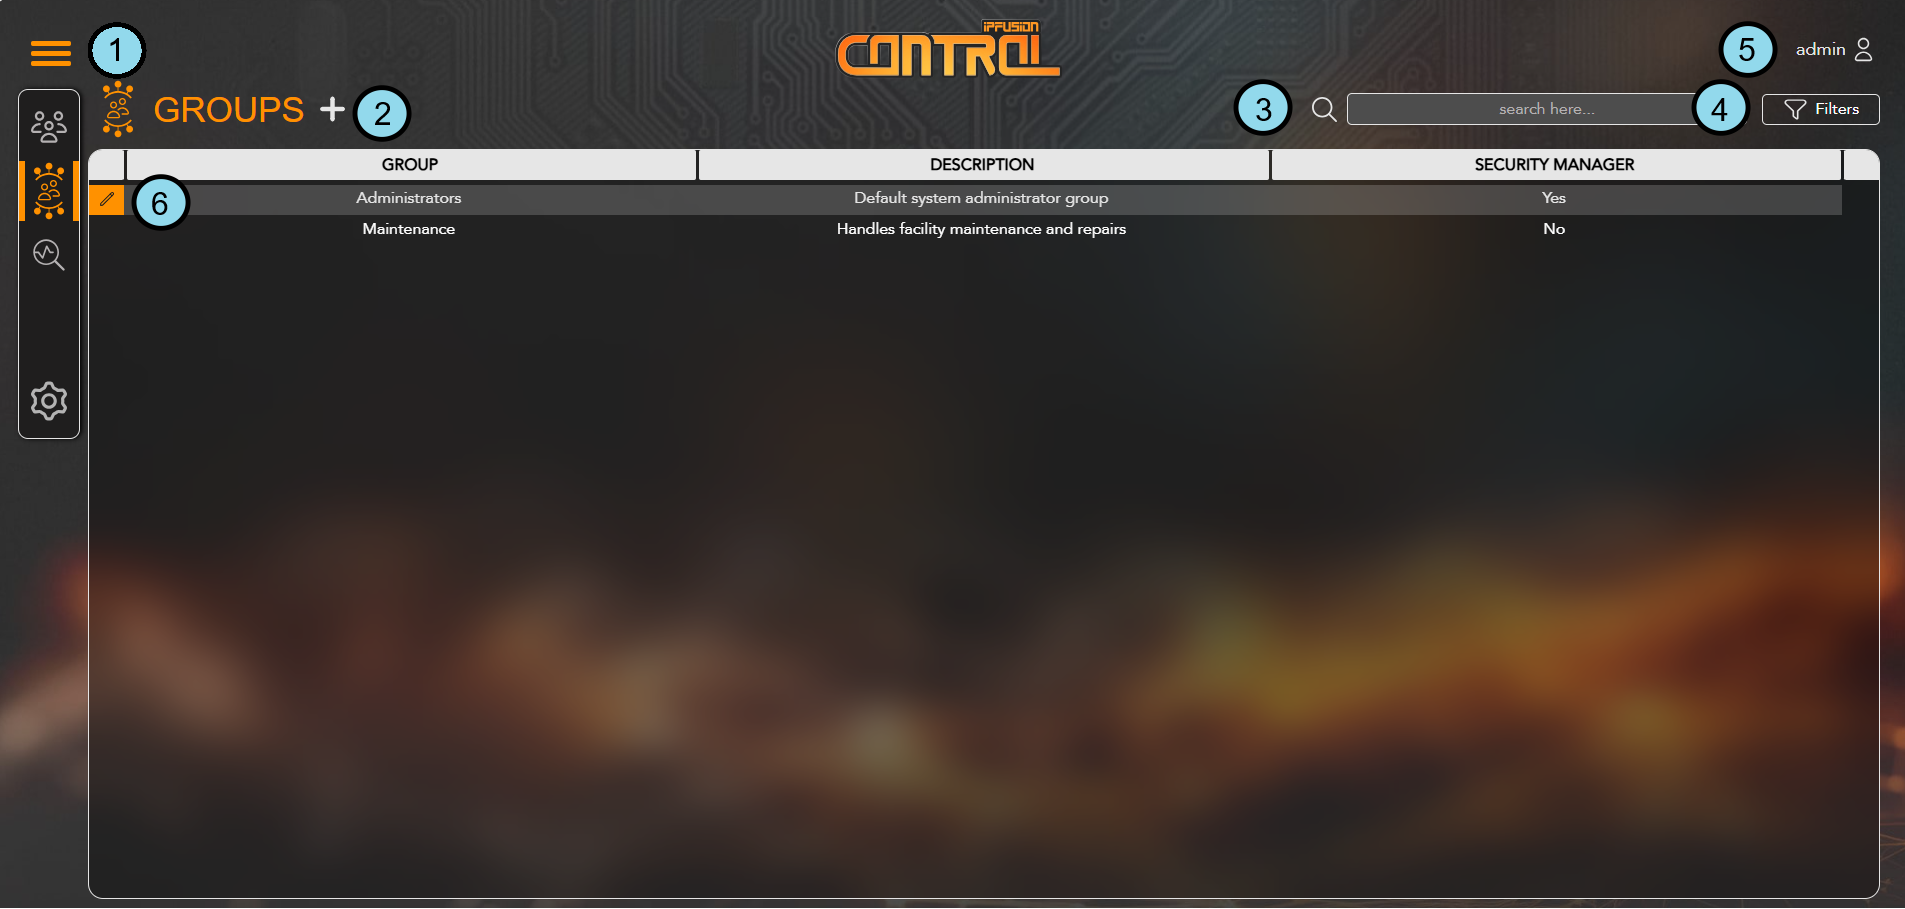
| 1. Menu | Displays three tabs for navigating between the Users, Groups, Diagnostics, and Admin interfaces. |
| 2. Groups + | Click the + sign to add a new group. |
| 3. Search Bar | Use the search bar to locate specific words or details within group profiles. |
| 4. Filters | Click the Filter button to sort users by their Manager status. |
| 5. User Profile | Quickly access options to change the user’s password or PIN, or to logout. |
| 6. Edit Group Profile | Click the Edit icon to update a group profile or toggle its Manager status. |
Diagnostics Dashboard
This dashboard lets you monitor the status of connected Workstations. This page can be accessed, regardless of the node state, at the following address: https://[IP address of Workstation]:5253/diagnostics.
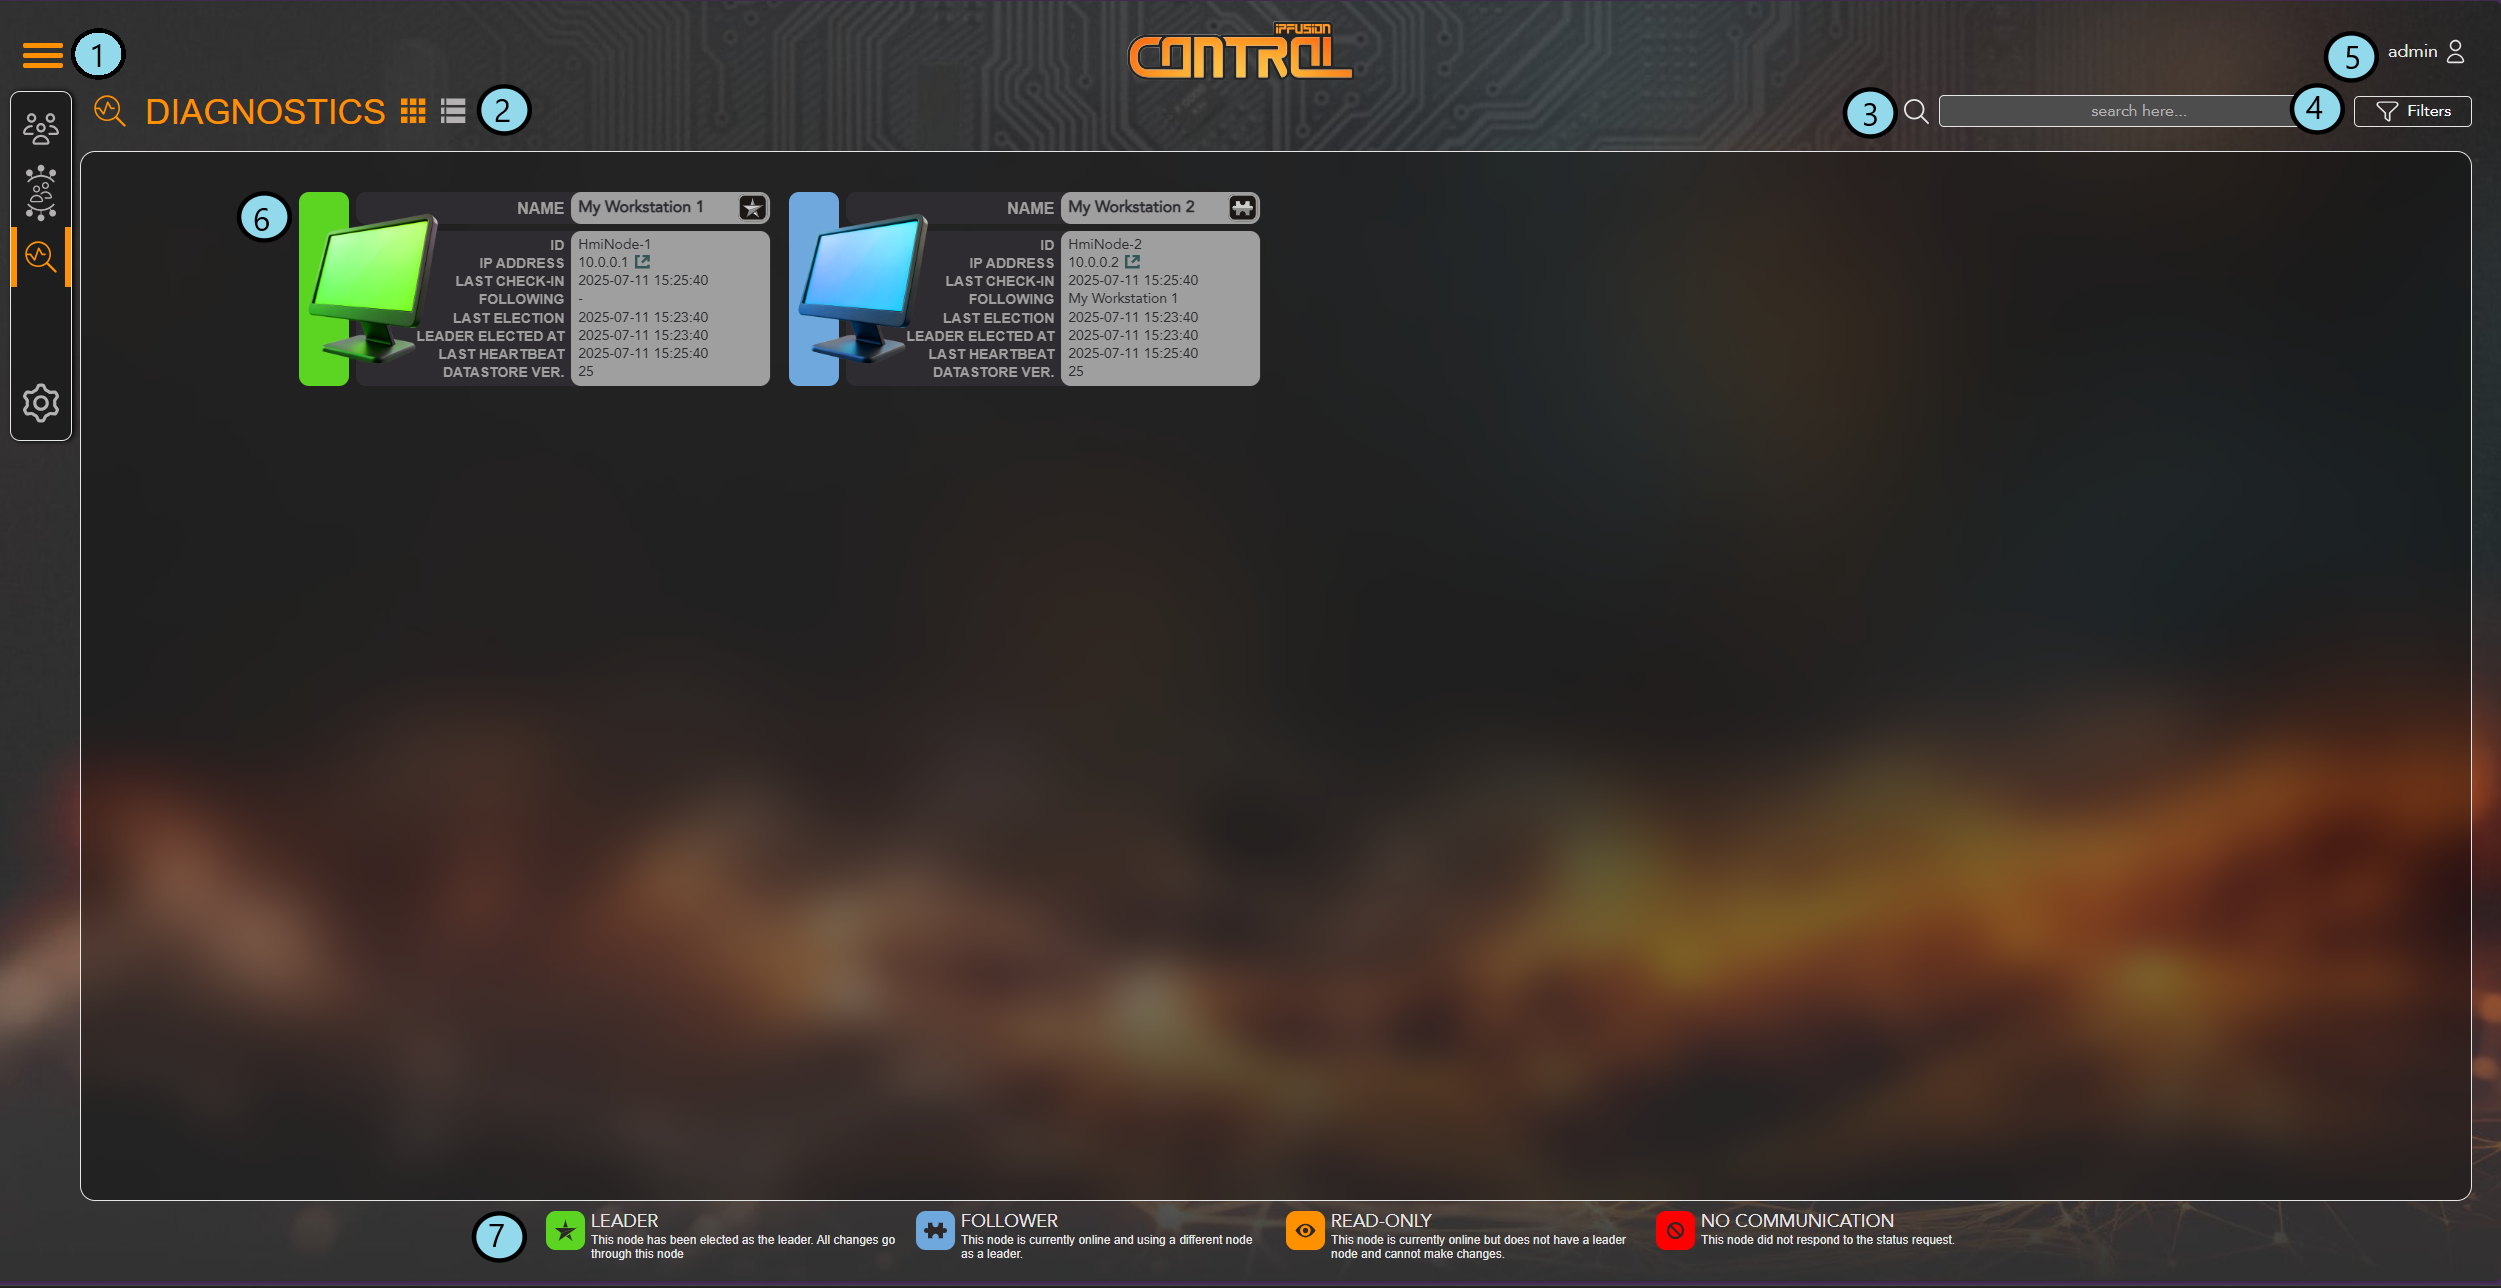
| 1. Menu | Displays three tabs for navigating between the Users, Groups, Diagnostics, and Admin interfaces. |
| 2. View Buttons | Displays either a List view or a Grid view of the Diagnostics page. |
| 3. Search Bar | Use the search bar to search either by name, ID, or IP address within the Workstation profiles. |
| 4. Filters | Click the Filter button to sort
Workstations by their status. This status can be one of the
following:
|
| 5. User Profile | Quickly access options to change the user’s password or PIN, or to logout. |
| 6. Workstation Profile | Display the Workstation's data. Check through the following:
|
| 7. Legend | A key that shows what different statuses each Workstation can have. |
8. Force Leader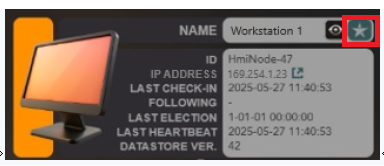 |
Click the star icon next to a
Read-Only Workstation to force it to
become the Leader. Note: This option is only available when all
other Workstations' statuses are either in Read-Only or No
Communication. |
Admin Dashboard
This dashboard allows you to customize the requirements for users when creating a password or PIN.
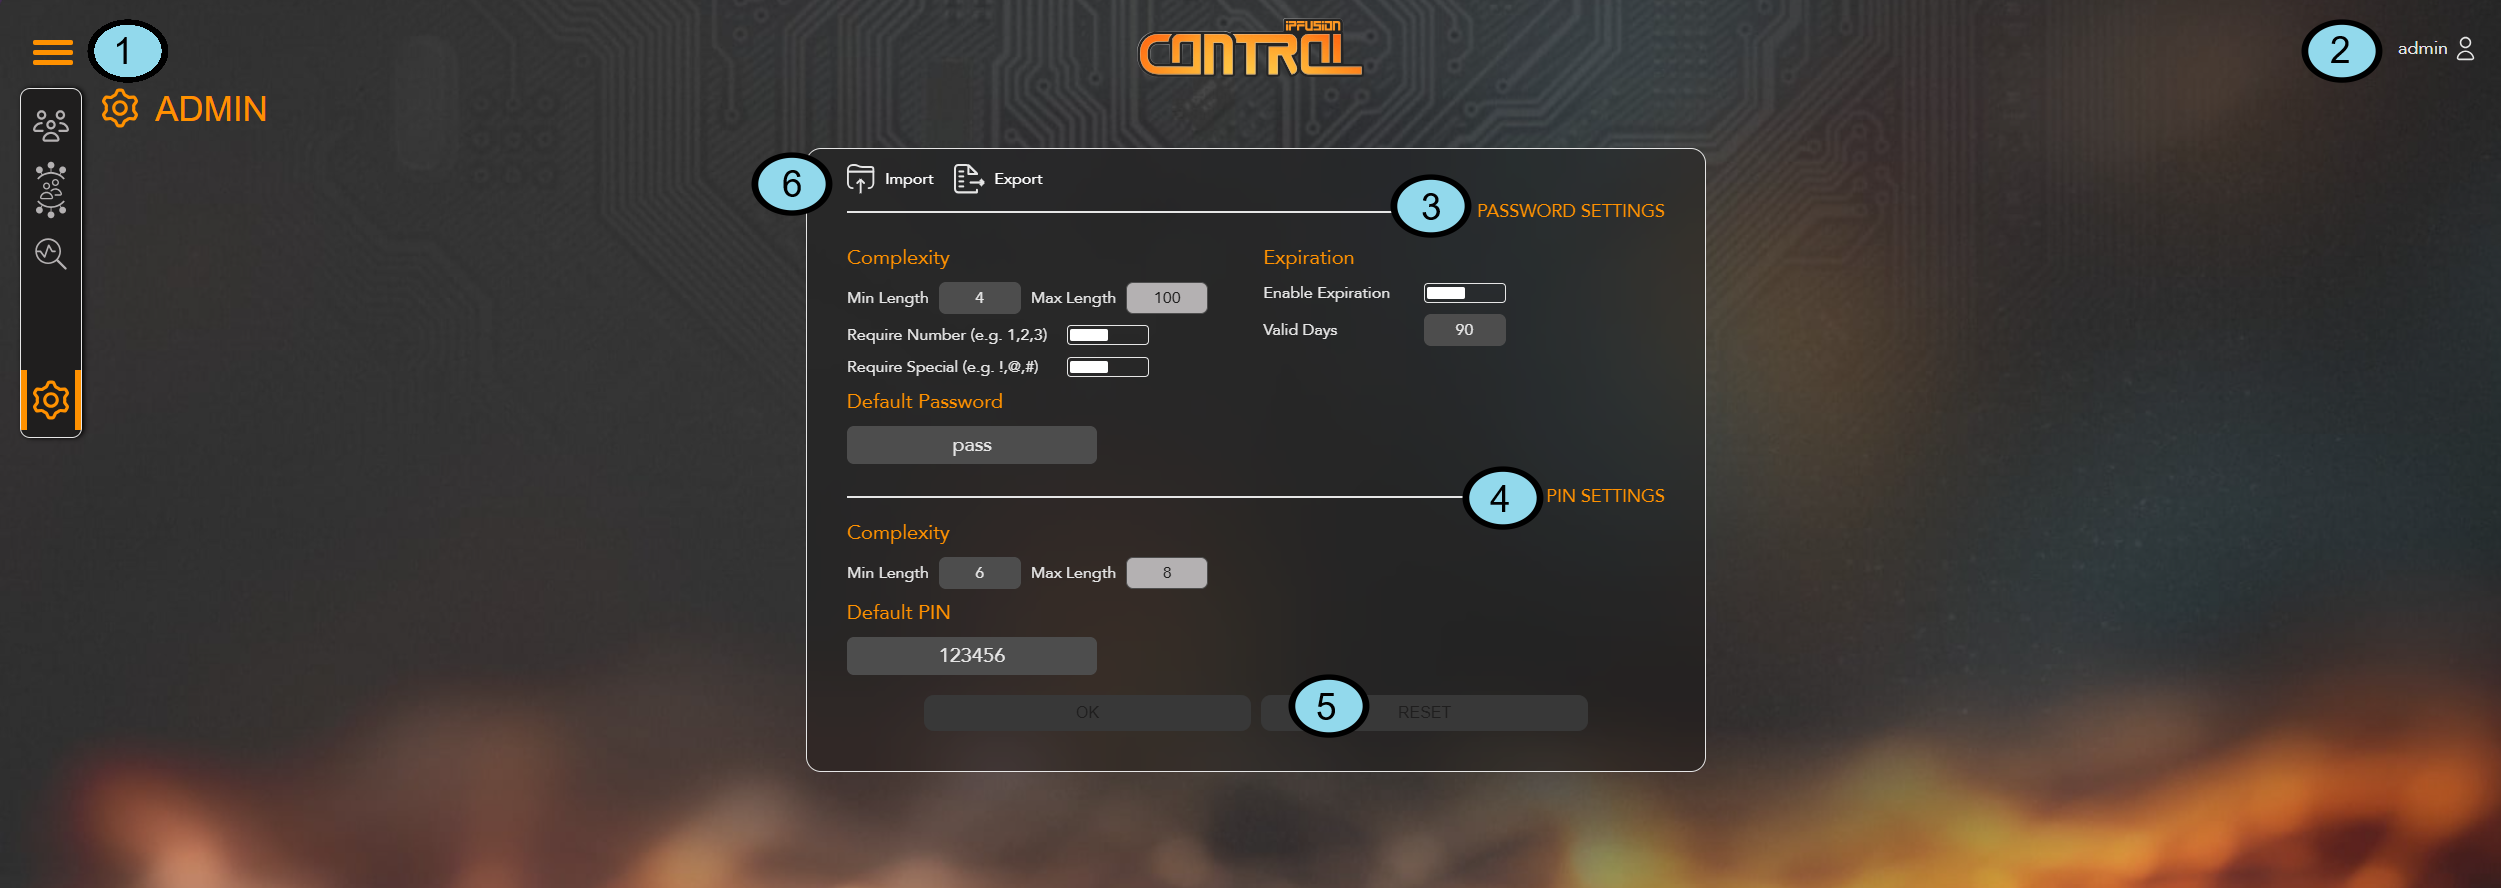
| 1. Menu | Displays three tabs for navigating between the Users, Groups, Diagnostics, and Admin interfaces. |
| 2. User Profile | Quickly access options to change the user’s password or PIN, or to logout. |
| 3. Password Settings | Require the created password to comply with specific
restrictions. Note: The maximum password length is 100
characters. Note: The default password must meet
complexity requirements before the changes can be
saved. |
| 4. PIN Settings | Modify the length of the PIN depending on your security
preferences. Note: The maximum PIN length is 8 characters.
Note: The default PIN must meet complexity
requirements before the changes can be saved. |
| 5. Reset | Restore all password and PIN settings back to its default values. |
| 6.Import and Export | Export Users, Groups, and Admin settings to a .JSON file. Import the file to overwrite existing settings with the saved data. |